
|
POLYVIEW-2D Documentation |
Index
- About POLYVIEW-2D
- Terms of use and disclaimer
- References to cite the server
- Manual
- Input data formats
- Custom view settings
- Examples of applications
- Review of protein structure prediction
- Analysis of protein complexes
- Mapping trans-membrane regions
- Review of amino acid conservation
- Automated annotations using scripts
- Related servers
- POLYVIEW-3D
- POLYVIEW-MM
- CoeViz
- Acknowledgements
Pictorial definitions used in POLYVIEW-2D for protein representation
|
Abbreviations used in this document
|
About POLYVIEW-2D
The POLYVIEW protein structure visualization server can be used to annotate proteins and visualize these annotations using sequence profiles, which include secondary structure, relative solvent accessibility, evolutionary conservation, coevolution of amino acid residues, and physico-chemical properties. It can also be used to identify residues involved in protein-protein, protein-ligand, and protein-DNA/RNA interactions and highlight other important sites and motifs. Customizable images with such annotations may be automatically generated using an API (provided below).
Terms of use and disclaimer
All images generated by the POLYVIEW-2D server can be FREEly saved, printed, and distributed by means of any media without our written permission for academic and non-commercial purposes. However, the use of POLYVIEW's pictures SHOULD be acknowledged by a reference to the server as defined below.
The use of the POLYVIEW server is at your own risk and no liability is accepted for any loss or damage arising through the use of the web site and protein annotations generated by the server.
References to cite the server
For citation in publications
To cite POLYVIEW-2D
A. Porollo, R. Adamczak, J. Meller (2004)
POLYVIEW: A Flexible Visualization Tool for Structural and Functional Annotations of Proteins,
Bioinformatics, 20: 2460-2462.
To cite CoeViz
F.N. Baker and A. Porollo (2016)
CoeViz: a web-based tool for coevolution analysis of protein residues,
BMC Bioinformatics, 17: 119.
For citation in presentation slides and web-resources
POLYVIEW-2D: //polyview.cchmc.org/
CoeViz: //polyview.cchmc.org/
Manual
Input data formats
The POLYVIEW server can process three types of input data:- A coordinate file with a 3D structure in the PDB format or a four-letter PDB code if a protein of interest can be found in the Protein Data Bank.
- To enter the PDB entry code, type 4 letters (e.g. 1a2x) in the corresponding text box.
- To submit a file, click on the respective Browse button and select a file to upload.
- To invoke a trajectory analysis by
POLYVIEW-MM, check a checkbox at the end of the section
Structural Data in 3D
Coordinates
. - Results from the protein structure prediction servers with secondary structures (SS) and relative solvent accessibilities (SA), order-disorder regions (DR) and domain boundaries (DP) in the CASP format. Results from our own prediction server SABLE may be submitted in the original format, as well.
- One can visualize sequence profiles by uploading files in the CASP format, including SS, DR, DP, and SA. In order to have these predictions combined, files can be simply concatinated to a single file before submission to the POLYVIEW server.
- At present, there is no standardized CASP format for the prediction of relative solvent accessibility. However, for this purpose, the same format as for the secondary structure prediction can be used, with the 'SS' value of the field 'PFRMAT' replaced by 'SA'. In such a case, columns in the sequence section of the file are supposed to contain: (1) one-letter amino acid residue label; (2) an integer number in the scale of 0 to 99 representing the level of exposure to solvent, or percentage of solvent accessibility; (3) a confidence score for the prediction (a real number in the range between 0 and 1).
- The original output from SABLE, which is sent by e-mail,
can be saved as a file and then submitted using the Browse button at the
Structural Data from Predictionssection. - SABLE results can be also retrieved for visualization using a job ID number that can be found in the link provided in output (look for 'FName=' followed by a number). However, this type of request is limited by two weeks since job completion, as results older than two weeks are automatically deleted from the server.
- Arbitrary protein sequence profiles (using copy-and-paste).
- Amino acid sequence is the only required data field when using this type of input. The remaining fields are optional.
- One can specify any combination of different sequence profiles, like secondary structure, its prediction confidence, relative solvent accessibility, etc. The only requirement is that the length of any annotation needs to be consistent with the length of the amino acid sequence.
- It is possible to submit multiple arbitrary sequences at a
time. In this case, all sequence profiles should be delimited by the hash
sign (#). For example, one can input three sequences
ACDE#FGHI#KLMNalong with three corresponding secondary structure profilesCCCC#HHHH#CCEC.
The server can process simultaneously all types of input submitted at the same
time, i.e. one can specify protein data originated from different sources in
the one request to get annotations both as isolated images and as aligned (merged) profiles for
comparison (for details refer to
Custom view settings section). Data processing
priority is the same as the order in the list above. For example, if
one enters a PDB code and, at the same time, some sequence data is
included as an arbitrary sequence profile, POLYVIEW-2D
generates first an annotation for a protein from PDB followed by
the data given in the Structural Data in Sequence Profiles
input section.
Custom view settings
Once a protein sequence annotation is generated, the user can customize its view. The following settings are available.
General settings
- Structure unit option enables switching between Asymmetric unit and Biological unit as deduced by the PISA (formerly PQS) server. This option appears only when a protein structure is submitted using a PDB code.
-
Representation of SS allows one to switch between different views
of graphical representations of protein secondary structures. There are
two views available at present. Examples are shown in
Figure 1.


Figure 1. Different views for graphical representation of protein secondary structure. - Background color sets a color for the image background. One can easily select a color using the link to the color picker utility. Default value is White.
-
Number of residues per line sets width of the image (see Figure 2).
Default value is 50 residues.

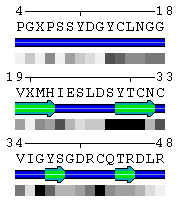
Figure 2. Number of residues per line (set to 50 in the upper panel and to 15 in the lower panel, respectively). - Start numeration from option is useful to adjust a numeration between sequence annotations derived from different sources. For example, one can set up the PDB-based starting number for a sequence taken from a prediction server to facilitate comparison. In case when a protein complex was submitted, it is possible to set up the starting numbers for each chain individually by enumerating them using comma for delimiting. If only one number is given, it applies to numeration of the all sequences. If no number is specified (i.e. an empty text box), the original numeration from the PDB file is kept.
-
Merge sequence annotations option
appears only when a protein stucture
submitted to POLYVIEW-2D contains at least 2 protein
sequences that are identical. It allows the user to align different 1D
profiles and merge them into a single image with multiple
annotations for a more convenient comparison.
- All proteins in the request should have the same amino acid sequences, whereas other accompanying profiles should be consistent in length.
- The resulting annotation will contain one joint numeration, amino acid sequence and physico-chemical profile for all sequences, whereas appearence of the other information will depend on the data provided for each sequence and selection of other view settings. Figure 6-2 demonstrates merging the sequence annotations shown separately in Figure 6.
Shown information
This section offers a context-based set of options. The number and type of settings that are displayed depend on input provided by the user. These options are divided into 2 groups: (1) options that allow one to hide some information shown by default; and (2) options that let one to add some data not shown in the default settings (Figure 3).
- Hide residue numbering option is always available and allows the user to include (or hide) the residue numeration in the protein sequence annotation (see Figure 3, B).
- Hide amino acid sequence option is always available, as well, and lets user hide a protein sequence (see Figure 3, C).
- Hide graphical secondary structure option appears only when related data are available. It allows one to hide graphical representation of secondary structures, when it is not of interest (see Figure 3, D).
- Hide bars of SS prediction confidence option appears only when data from a protein structure prediction server are submitted. It allows one to hide graphical representation of the prediction confidence.
- Hide relative solvent accessibility option appears whenever residue relative solvent accessibility data are available. It lets the user exclude the information about RSA (see Figure 3, E).
- Hide bars of RSA prediction confidence option appears only when respective data from protein structure prediction server are submitted. It allows one to hide graphical representation of the prediction confidence for relative solvent accessibility.
- Show chemical property profile option is always available and lets the user add to sequence annotation the information about the corresponding physical-chemical profile of amino acids. This can be useful, for example, to find correlations between relative solvent accessibilities patterns and a hydropathy profile (see Figure 3, F).
- Show letter code for secondary structure option appears whenever secondary structure data are provided. This allows the user to use traditional representation of secondary structure (H,E,C) instead of or in addition to the graphical representation (see Figure 3, G).
- Show numerical SS prediction confidence option appears when data from protein structure prediction servers are submitted. This lets the user view a predicted structure using a numerical rather than graphical representation of confidence factors.
- Show numerical relative solvent accessibility option appears whenever corresponding data are available. This is an alternative representation for the relative solvent accessibility with numerical values of RSA rather than graphical gray scale grade bar (see Figure 3, H). RSA ranges from 0 to 9, with 0 corresponding to fully buried (0-9% RSA) and 9 corresponding to fully exposed residue (90-100% RSA), respectively.
- Show numerical RSA prediction confidence option is available when respective data are provided. Numerical confidence factors are presented instead of or in addition to graphical bars of the prediction confidence.
- DSSP output settings appear when a protein structure is submitted using a coordinate file. In order to obtain values for RSA and protein SS states, POLYVIEW-2D runs DSSP that may produce some warnings and error messages. Using the options for DSSP output, one can get this additional information as part of the resulting web-page, as well as request to mark those residues that have inaccurate solvent accessibility indicated by DSSP.
| A | B | C | D |
|---|---|---|---|

|

|

|

|
| E | F | G | H |

|

|

|

|
| Figure 3. Examples of different types of sequence annotations for the protein Mastoparan-X (PDB code 1a13) generated using options from the Shown information set. A. Annotation produced by default settings after initial data submission. B-H. Results of applying individual settings described above. | |||
Highlighting options
These options enable the labeling/highlighting of specific residues.-
Individual residues option provides
the user with the opportunity to emphasize any amino acid sequence
fragment or motif (see Figure 4). The
highlighted residues can represent, for example, polymorphic or
interfacial sites.
- Residues can be highlighted by changing the color or/and the font style of amino acid labels. Available colors are red, green or blue. They can be specified by their corresponding first characters (R,G,B).
- The font style can be used to alter between regular and bold style only.
- In case of protein complexes, a chain label for residues to highlight needs to be specified as well.
- Positions of residues to be highlighted should be enumerated with comma delimitation (white spaces are ignored). The use of dashes to define a range of numbers is also supported.
The syntax of the string used to specify residues to be highlighted is the following:
[Chain_label:]Residue_number[:Color], where '[ ]' denotes optional parts of the string. Capital letters R, G, or B are used to highlight a residue in both color and bold font style, whereas lower case characters result in highlighting by the corresponding color only.Below are several examples:
A:145:r - highlight the 145th residue in chain A using red color
C:5-10 - highlight residues from 5 through 10 in chain C using bold style
14-17,25-30,43:b - highlight residues 14, 15, 16, 17, 25, 26, 27, 28, 29, 30 in the first chain using bold font and blue color for residue 43
A:3,A:10-20,A:35,B:15-20,B:25,B:40 - highlight residues 3, 10-20, 35 in chain A using bold font and residues 15-20, 25, 40 in chain B using the same style
Figure 4. Example of highlighting residues. To generate this picture, the option was set to 2-16:b,18,20,22,24-36:R. -
Trans-membrane residues option allows
one to highlight trans-membrane regions in a protein using
yellow background (Figure 8).
- Residues are highlighted by changing background, therefore no color needs to be specified. Although, this highligting option can be used in conjunction with the one described above.
-
In case of protein complexes, a chain label for residues of
interest needs to be specified, as well. Thus, a syntax for this
option is:
[Chain_label:]Residue_number. - Positions of residues to be highlighted should be enumerated with comma delimitation (white spaces are ignored). The use of dashes to define a range of numbers is also supported.
-
Residues at S-S bridges is an option
that appears only when a protein structure is submitted in the
PDB format and there are disulphide bridges (S-S) in the structure.
Upon request of this option, the server performs automatic highlighting of
those cysteines linked by S-S bridges found by the DSSP program.
Identified residues are marked using the bold font style and colored yellow.
Moreover, pairs of cysteines are labeled per a bridge by low case characters in the residue
numeration line. Figure 5 gives an example
of the S-S bridge highlighting using a protein structure with the
PDB code 1acw.

Figure 5. Example of highlighting cysteines at S-S bridges. -
Protein-protein interface set of options
appears only when a protein complex is submitted in the PDB
format. It enables automatic recognition and highlighting of
those residues that are at the protein-protein interaction
interface (see Figure 7 or
Figure 7-2). Selected residues are
marked using magenta and the bold font style.
The RSA change threshold option has two input fields and becomes enabled when the option Automatic identification is checked. Structures of a protein complex and its isolated chains are analyzed using the DSSP program in order to determine changes in solvent accessibility of residues in the complex as opposed to isolated chains. By default, the SA change cutoff is defined in relative scale, with 4% difference in surface exposed area triggering the highlighting (see results of different cutoffs in Figure 7 and Figure 7-2 in the Examples section). One can also specify the absolute cutoff (using Å2) for the SA change to identify residues at the interface.
- Protein-DNA/RNA interface set of options appears only when a protein is submitted in the PDB format and there are DNA (or RNA) chains defined as part of the structure. It enables automatic recognition and highlighting of those residues involved in protein-DNA/RNA interaction. Residues can be identified by the server when the option Automatic identification is checked. Residues binding nucleotides are marked using cyan and the bold font style.
- Protein-ligand interface set of options appears only when a protein is submitted in the PDB format and there are small molecules or metal ions defined as part of the structure. It enables automatic recognition and highlighting of those residues involved in protein-ligand interaction. Residues can be identified by the server when the option Automatic identification is checked. Residues binding a ligand are marked using red and the bold font style.
More options to come...
All view settings described above are applied after the Update button is pressed.
All options can be used in combinations with others. Previous values of settings can be
restored using the Reset button.
Examples of applications
Below are several examples demonstrating how the POLYVIEW-2D server can be used for structural and functional annotations.
-
POLYVIEW-2D is a fast and convenient tool to view the results from
protein structure prediction servers.
PDB 
SABLE 
Prof 
PsiPred 
Figure 6. Example of SS and SA predictions for the 50S ribosomal protein L9 (PDB code 1cqu). Results derived directly from the PDB and from the prediction servers SABLE, Prof, and PsiPred are compared. Colored bars below SS represent confidence level for structure prediction. PDB 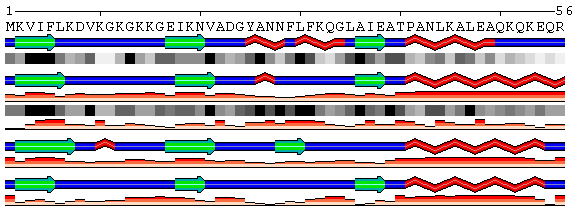
SABLE Prof PsiPred Figure 6-2. Example of the sequence annotations alignment for the same data as shown at Figure 6 using option Merge sequence annotations. To generate the above annotations, different types of input data were used. A PDB code was used to retrieve the actual structure. SABLE prediction was submitted from a file in the original SABLE format. PsiPred prediction was submitted using the copy-n-paste into the
Structural Data in Sequence Profilessection. Prof results were submitted using a file in the CASP format. -
POLYVIEW-2D can be used for automatic identification of residues
located at protein-protein interaction interfaces.
State/Chain Chain A Chain B In the complex 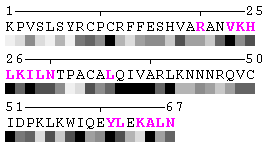
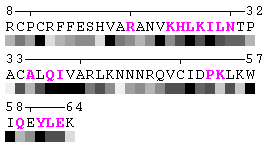
As isolated chain 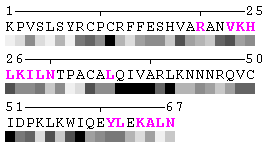
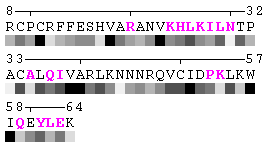
Figure 7. Example of an automated recognition of residues at a protein-protein interaction interface (using a protein complex with the PDB ID: 1a15). Residues highlighted in magenta and bold have different RSA in the complex relative to isolated chains and are, therefore, identified as sites of contact between two chains. Absolute threshold 10Å2 of the SA change was used in order to define interaction sites. The individual values of solvent accessibility are normalized to the range 0-9 and are presented in the form of grayscale bars. In some cases (e.g. in case of big residues such as tryptophan), the change of 10Å2 or even more may not result in a shift of a residue to another bin of RSA because it will not exceed 10% of the residue nominal SA. On the other hand, some smaller than 10Å2 changes in SA may lead to the change of the RSA bin because of rounding. One can find an example of the first case in chain A, residue 64 (lysine, K), and the latter case in chain A, residue 31 (threonine, T), respectively (see Figure 7). Thus, it is strongly suggested to rely on the built-in feature of automatic identification of interfacial sites rather than visual comparison of changes in RSA patterns in a protein complex relative to isolated chains.
State/Chain Chain A Chain B In the complex 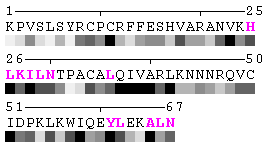
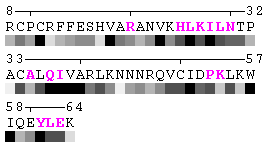
As isolated chain 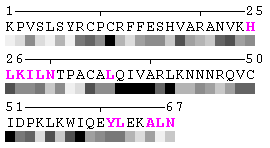
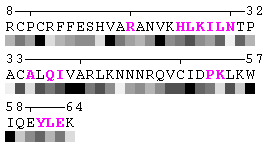
Figure 7-2. The same subject for automatic recognition of residues at the protein-protein interaction interface as in Figure 7 has been used. But in this case the relative threshold 10% of the RSA change has been used in order to define interaction sites. The advantage of using relative change in SA in order to identify interfacial vs non-interfacial sites is that this definition is more likely to capture conserved residues that have real changes in RSA (rather than slight random changes caused by presence in interface neighborhood). On another hand, this measure is less sensitive to the changes in SA for big amino acid residues, such as tryptophan. In the latter case, the absolute change of SA should be more than 20Å2 in order to assign this residue to interfacial one with the relative cutoff of 10% RSA.
-
POLYVIEW-2D performs the analysis of trans-membrane proteins in order to
detect trans-membrane regions.
PDB 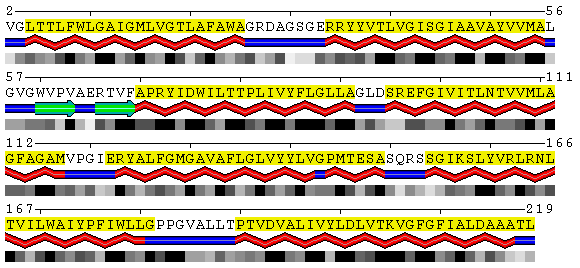
SABLE 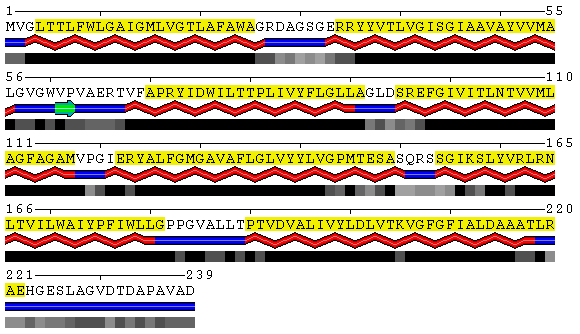
Figure 8. Visualization of the trans-membrane protein Sensory Rhodopsin II (PDB code 1h68). Residues highlighted by yellow background are located in trans-membrane regions according to Swiss-Prot database (Swiss-Prot code P42196). Upper panel shows the results obtained from the DSSP program as applied to this structure without accounting for different environments. Lower panel contains the SABLE server prediction that indicates residues with low water accessible surface area coinciding with membrane regions. Combination of the SABLE prediction and the POLYVIEW annotation provides a convenient tool for a trans-membrane regions identification. Protein sequence of a known membrane protein was submitted to SABLE in order to obtain an example of how SABLE can be used to indicate the presence of membrane domains. The prediction shown above reveals long alpha-helices and fully "buried" residues (meaning residues with low water accessible surface area). It coincides with the actual data about trans-membrane regions derived from the corresponding Swiss-Prot entry.
-
POLYVIEW-2D can compute conservation scores for each position in a protein and
map these scores onto the sequence using different colors for background.
Conservation scores are Shannon entropy normalized to [0, 1] and
derived from the PSSM files generated by PSI-BLAST after 3 iterations against the
NCBI nr database.


Figure 9. Mapping conservation scores to the RING domain of ubiquitin ligase enzyme Rad18 (RING E3; PDB code 2Y43, chain A). Top panel: Highlighted red are the residues binding Zn ions identified using the Protein-ligand interfacehighlighting option described above. Middle panel: Conservation profile facilitates identification of residues involved in Zn binding showing them as the most conserved. Bottom panel: Color scale for conservation profile. The yellow background means the scores could not be reliably derived having a low number of aligned sequences.
Automated annotations using scripts
The POLYVIEW-2D server can be used for automated large scale annotation tasks. Below is a perl script that allows one to set up default view settings for multiple protein sequence annotations. For the batch mode, our script can read input files with multiple queries and submit them one by one.
To download a script, click here. Last edition was made on April, 2013.
The package consists of 2 files:polyview.pl- the perl script to query POLYVIEW-2Doptions.txt- an options file used by the script
Make sure that your computer has the following software installed:
-
Perlavailable at the perl home page. -
libwww-perlmodule available at its home page or at any other CPAN module collection sites.
For those, who conduct their own large scale studies, but would like to compare results with our methods, such as SABLE, SPPIDER, and others, we provide a script parsing the DSSP output with two alternative normalization tables to compute relative solvent accessibility (RSA). The script can be downloaded here.
Related servers
POLYVIEW-3D
If a protein structure is submitted as a coordinate file in the PDB format, the resulting page will have a link to generate 3D animated images and publication quality slides using POLYVIEW-3D. In addition, the server provides the user with versatile structural and functional analysis. For details and examples, please refer to the POLYVIEW-3D tutorial.
POLYVIEW-MM
If a submitted coordinate file represents a protein structure in
motion, such as a molecular dynamics trajectory, morph or
NMR models, the user can invoke a trajectory analysis and
its 2D visualization by
checking the corresponding checkbox on the submission form
in the Structural Data in 3D Coordinates
section.
For more details, please refer to the POLYVIEW-MM
documentation.
CoeViz
After submitting a query to POLYVIEW-2D, the user has an option on the resulting page to generate and analyze pairwise coevolution scores for all residues in the query protein. Coevolution scores are computed using three metrics: Mutual information, Chi-square statistic, and Pearson correlation. Joint Shannon entropy as pairwise conservation can also be computed. Interactive analysis and visualization include: cluster tree, zoomable heat map, and relationship circular diagrams. For more details, please refer to the CoeViz documentation.
Acknowledgements
For a complete list of people involed in related projects, software used, and funding, please visit the dedicated page.
Last update of the document: March, 2016
Back to the POLYVIEW-2D server home page


