POLYVIEW-3D Tutorial
Part 4. Residues highlighting settings
This set of options allows one to specify individual amino acid residues to be highlighted by either color or different type of rendering contrasting to the rest of the structure. Residues to be highlighted can also be selected automatically, using several predefined annotation options that allow one to identify sites of interest, e.g., evolutionarily conserved functional hotspots, protein-protein interaction interfaces, etc.
Individual residue highlighting
POLYVIEW-3D provides a possibility to highlight a list of residues
that represent, e.g., some structurally or functionally
relevant group. This can be achieved by using a different
color, different rendering style (e.g., sticks vs.
cartoon model for the rest of the chain), or by the
combination of those. The list
of residues to be highlighted may be specified using a
text input field included in the Highlighting settings.
The format for custom highlighting is as follows:
[Chain:]Residue:{Color|Rendering},
where Chain is an optional chain label of the
chain a residue of interest belongs to;
Residue is the order number of a residue (along
with an optional insertion code, e.g., 10A, 10B, 10C if
three alternative definitions of the residue number 10 are
provided in a PDB file); Color is
represented by a single letter from a pre-defined set of
possible values:
| Code | Color | |
|---|---|---|
| R or r | red | |
| G or g | green | |
| B or b | blue | |
| M or m | magenta | |
| C or c | cyan | |
| Y or y | yellow |
Rendering is also represented by a list of possible letters:
| Code | Rendering | |
|---|---|---|
| S or s | side chains as sticks | |
| F or f | atoms as spheres | |
| U or u | as surface when rendered by PyMol and as spheres by RasMol | |
| T or t | as transparent surface with the same availability upon rendering program | |
| V or v | as side chain sticks under transparent surface, again available for PyMol only with replacement by spheres in case of RasMol. |
For example, string A:5-10:r,A:27:bs,B:101-103:f would
result in the rendering of residues 5 through 10 of chain A in
red; residue 27 of the same chain in blue with its side
chain shown using sticks; and all atoms of residues 101
through 103 of chain B shown as spheres.
NOTE: if at least one residue is specified to be rendered with transparent surface, all other surfaces will also be shown as transparent, as a result of a global setting in PyMol, which is applied to all instances of surface representation.
If a few residues are to be highlighted, one can enter the list (and
the corresponding selection string) manually. However, for
more complex annotations, we recommend a list conversion
tool, which is available via
Converter
link located next to highlighting option. This tool allows
one to process a residue list in two ways, converting a
simple selection string to the POLYVIEW format, while
taking into account color and 3D rendering
settings to be applied, and in the opposite way, allowing
one to generate a plain list of residues from the one
formatted automatically by the server, e.g., when
performing various structure analyses. In both cases,
these strings can be copied from or pasted to the
respective text fields, faciltating the task
performed.
NOTE: the adjacent numbers of residues can be
replaced by their range defined by hyphen (e.g.,
10-12:v instead of 10:v,11:v,12:v).
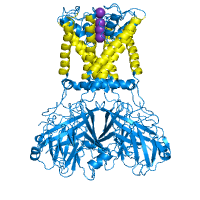
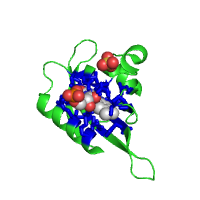
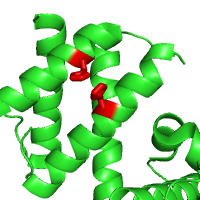
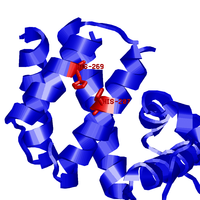
Examples below illustrate custom residue highlighting by using different colors and rendering styles. Protein in the left panel is the potassium channel KirBac1.1 in the closed state (PDB id 1p7b), with residues in transmembrane (TM) regions colored yellow. For contrast, the soluble parts of all chains are colored light blue. TM regions are taken from the PDBTM database. The panel in the middle represents a ligand binding pocket of the Phot-LOV1 domain (PDB id 1n9l), as identified by the CASTp server, colored in blue and rendered with side chains. The right panel shows two histidines (His207 and His269) as important phosphorylation sites that regulate the dimerization of LicT regulatory domain (LicT-PRD, PDB id 1tlv). The residues of interest are colored red and rendered as sticks.
| Membrane spanning regions | Ligand binding pocket | Phosphorylation sites |
|---|---|---|
|
|
|
| Click on respective image to see options used for its rendering. | ||
Highlighting by interaction
The POLYVIEW server provides an option for automatic protein interface
recognition and subsequent highlighting. Obviously, the
input structure has to contain multiple protein chains in
order to have this option work.
Residues found to be within the
interaction interface can be optionally highlighted using
one of the following options:
colored in red,
side chains rendered as sticks,
or represented as spheres.
The corresponding per-chain list of residues will appear at
the resulting annotation page, next to the image of the
complex.
In order to define protein interaction interfaces, the change in solvent accessibility area (SA) upon complex formation is calculated for each residue using the DSSP program. For that purpose, the solvent exposed surface area of each residue is computed twice: using the isolated chain considered as unbound structure, and the protein complex that represents the bound state:
dSA = SA(Unbound) − SA(Bound)
Residues with dSA of more than 4% of the maximum possible surface exposed area for a given type of amino acid, and more than 5 Å2, are assigned as interacting sites (see SPPIDER paper for the justification of this particular choice). In order to use non-default settings one has to use the SPPIDER server first, and then refine the image in POLYVIEW-3D.
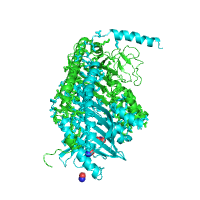
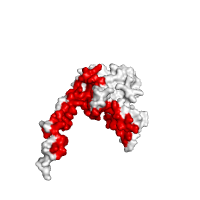
Example shown below illustrates the automatic recognition of protein interface between alpha and beta subunits of chicken sarcomeric capping protein CapZ (PDB id 1izn) based on the structure of its biological unit.
| Interacting sites with side chains | Interface in red |
|---|---|
|
|
| Click on respective image to see options used for its rendering. | |
Highlighting by conservation
Another way of highlighting the residues provided by POLYVIEW-3D is to calculate their corresponding conservation scores based on multiple sequence alignment (MSA). By setting different thresholds, one can obtain a list of either highly conserved residues or the most variable ones, thus identifying potentially interesting and functionally relevant regions of the protein. Highlighting those residues can be performed in the same manner as described in previous section.
In order to calculate conservation scores, POLYVIEW-3D server uses frequencies of amino acids occurred at a given position obtained using MSA against NCBI nr protein database. Based on these frequencies, the amino acid entropies are computed as follows:
S = −∑i (Fi * ln(Fi)) / ln(N)
where N is the number of amino acids (20), and Fi is the frequency of i-th amino acid at a given position. The resulting conservation score C is computed as:
C = {integer((1 − S)*10), 9 if C > 9}
Thus, C=0 represents the most variable positions, whereas C=9 the most conserved ones.
Note that this definition is different to that used by the ConSurf server, which provides an alternative assessment of evolutionary conservation and mapping of putative functional hot spots (please refer to ConSurf documentation for details). However, POLYVIEW-3D also accepts PDB files generated by the ConSurf server with B-factors modified according to its conservation scale and produces the images with the original ConSurf coloring scheme (see section Advanced structure annotation for details).
Highlighting residues based on their conservation scores is similar to the option available in Chains coloring and rendering field set. However, instead of coloring the whole chain, only selected residues are highlighted based on the threshold applied to conservation scores.
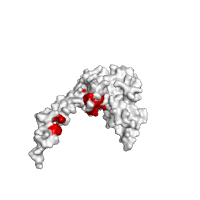
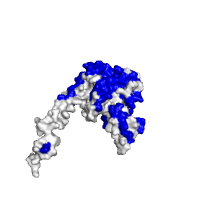
Images below demonstrate this option, using the same protein complex as in previous section (PDB id 1izn). As can be seen from these images, highly conserved residues are mostly located at the protein interface, whereas the rest of the structure is rather variable in this case.
| Conservation score > 6 | Conservation score < 3 |
|---|---|
|
|
| Click on respective image to see options used for its rendering. | |
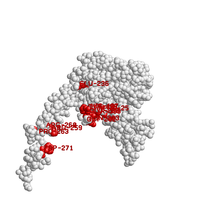
One can optionally request to show text labels for highlighted residues. However, we suggest that labels should be used for reference only, e.g., when locating specific residues. For the final image, it is recommended to add labels manually by using a third-party graphics editor.
Below are examples of rendering with labels for highlighted residues, using again the same proteins as above (PDB ids 1izn and 1tlv).
| Highly conserved spots | Phosphorylation sites | |
|---|---|---|
|
|
|
| Click on respective image to see options used for its rendering. | ||
Last modified: Thu Feb 9 13:36:29 EST 2012